Enjoy Premium Plans at
Signup
~50% OFF

100% Stacked Area Chart PowerPoint Template
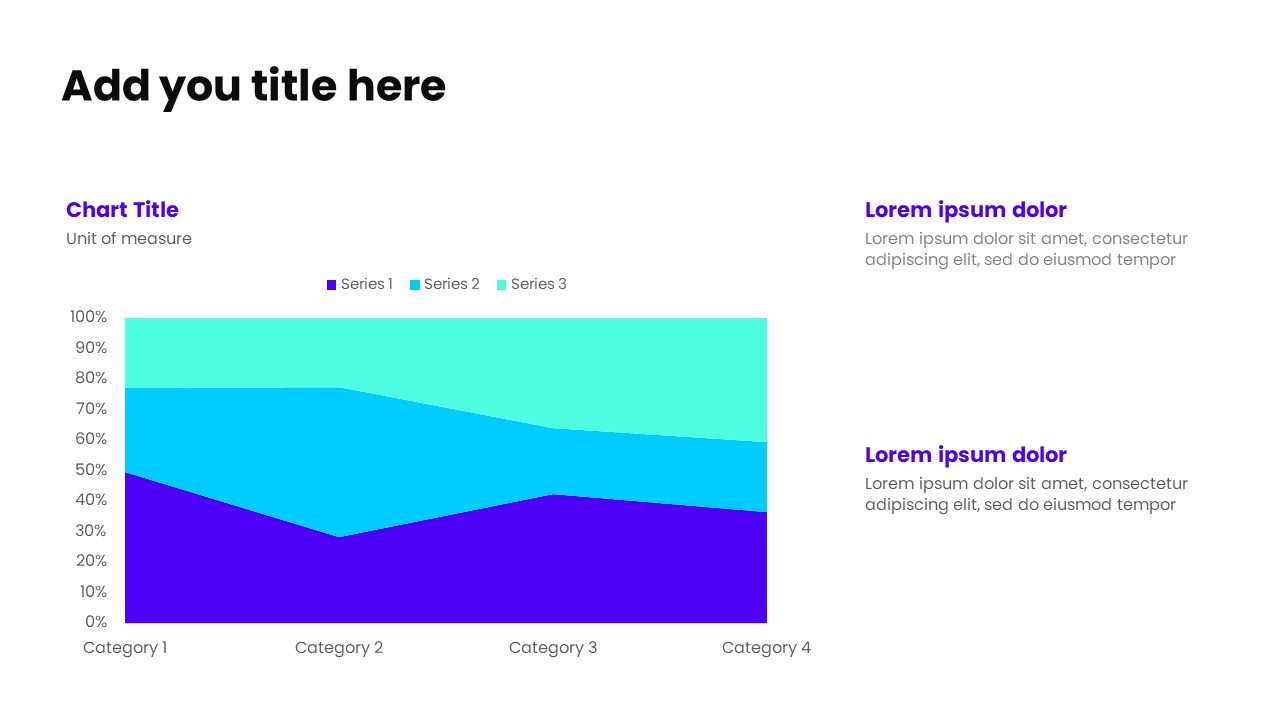
Analyze how categories contribute to the whole over time using this 100% stacked area chart PowerPoint template, where the total at each point equals 100%. The chart on the left clearly displays percentage-based distribution trends, supported by a unit-of-measure header (100%) for instant clarity. On the right-hand side, multiple headers with concise supporting text explain shifts in share, dominance, and key proportional insights.Ideal for market share evolution, composition trends, and comparative ratio analysis, this layout helps audiences focus on relative change rather than absolute values. Fully editable and designed for professional, data-driven, and executive presentations.
No reviews and ratings yet.
-
 Ready-made slides
-
Easy to customize
-
For personal & business