
100% Stacked Bar Chart PowerPoint Template
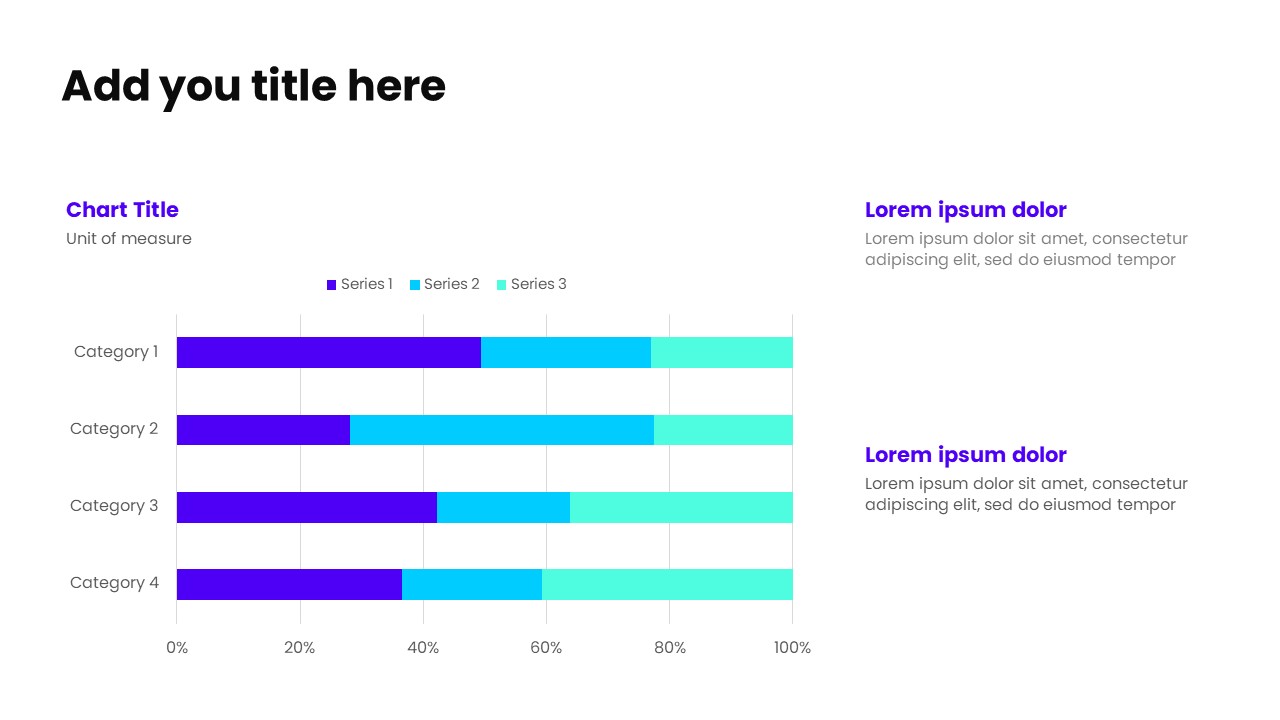
This slide showcases a 100% clustered bar chart on the left, designed to illustrate proportional comparisons across categories with absolute clarity. Each bar represents a full 100%, making it easy to visualize how individual segments contribute to the whole. On the right, a clean text section with a clear header and supporting subtext provides space to explain insights, highlight patterns, or summarize key takeaways.Ideal for composition analysis, percentage-based comparisons, market share breakdowns, and survey results, this layout combines visual precision with contextual explanation. The balanced design ensures audiences can quickly understand relative distributions while reinforcing insights through concise, well-organized supporting text—perfect for professional, data-driven presentations.
No reviews and ratings yet.
-
 Ready-made slides
-
Easy to customize
-
For personal & business