Enjoy Premium Plans at
Signup
~50% OFF

100% Stacked Column Chart PowerPoint Template
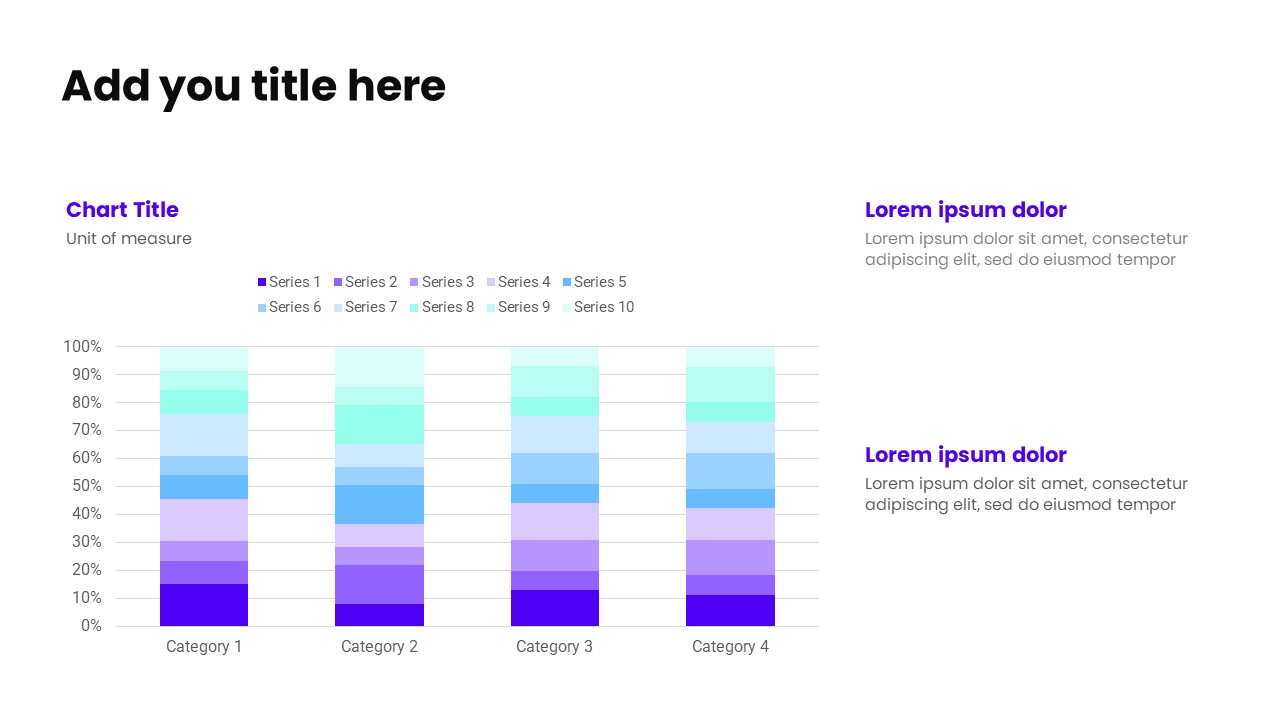
Compare proportional contributions across categories using this 100% stacked column PowerPoint template, where each column represents a complete whole. The chart on the left highlights percentage distribution clearly, supported by a header with unit of measure (100%) for instant understanding. On the right-hand side, multiple headers with concise supporting text explain trends, segment share, and key takeaways.Ideal for market share analysis, composition comparisons, performance ratios, and executive dashboards, this layout helps audiences focus on relative contribution rather than absolute values. Fully editable and designed for business, consulting, and data-driven presentations.
No reviews and ratings yet.
-
 Ready-made slides
-
Easy to customize
-
For personal & business