
3D 100% Stacked Area Chart PowerPoint Template
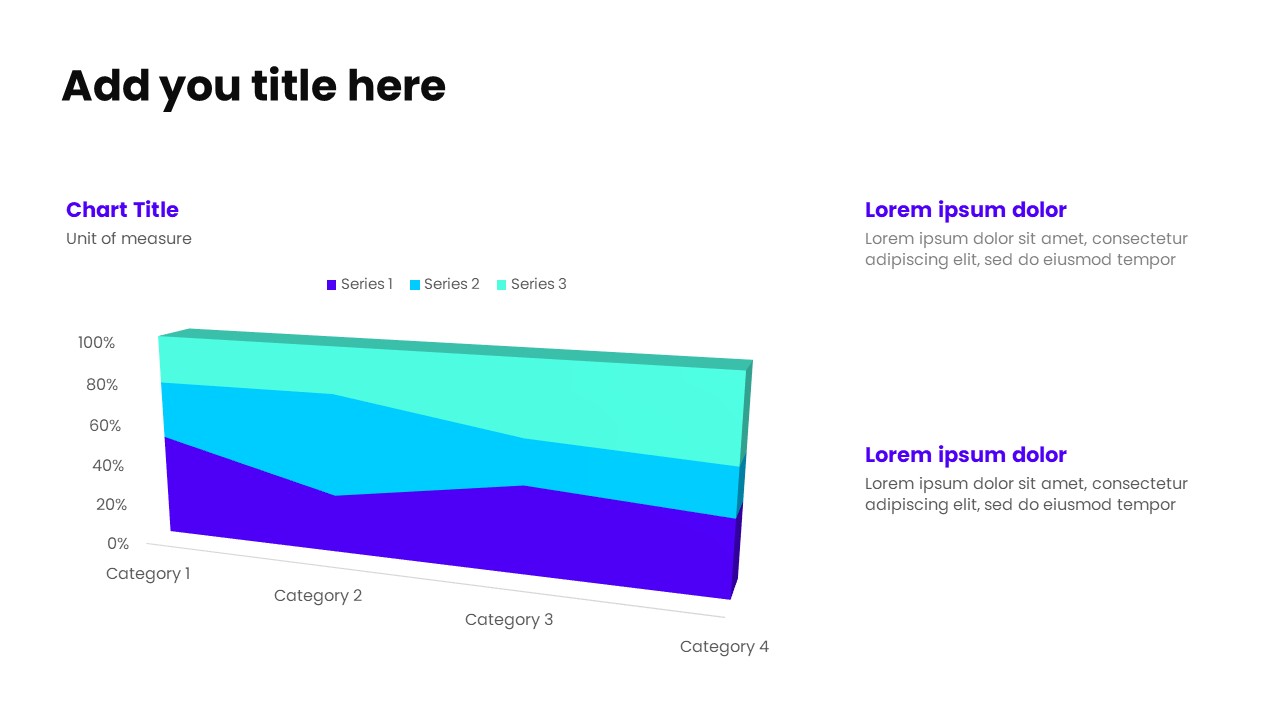
Show cumulative trends with enhanced visual depth using this 3D stacked area chart PowerPoint template, where multiple data series are layered to display overall growth and category contribution over time. The chart on the left provides a strong visual hierarchy, supported by a header with unit of measure for quick interpretation. On the right-hand side, multiple headers with concise supporting text explain trends, segment behavior, and key takeaways.Ideal for performance accumulation, category comparison, and executive reporting, this layout blends dimensional visuals with clear explanations—making complex stacked data more engaging and easier to understand. Fully editable and designed for business and data-driven presentations.
No reviews and ratings yet.
-
 Ready-made slides
-
Easy to customize
-
For personal & business