Enjoy Premium Plans at
Signup
~50% OFF

Area Chart PowerPoint Template - S1113
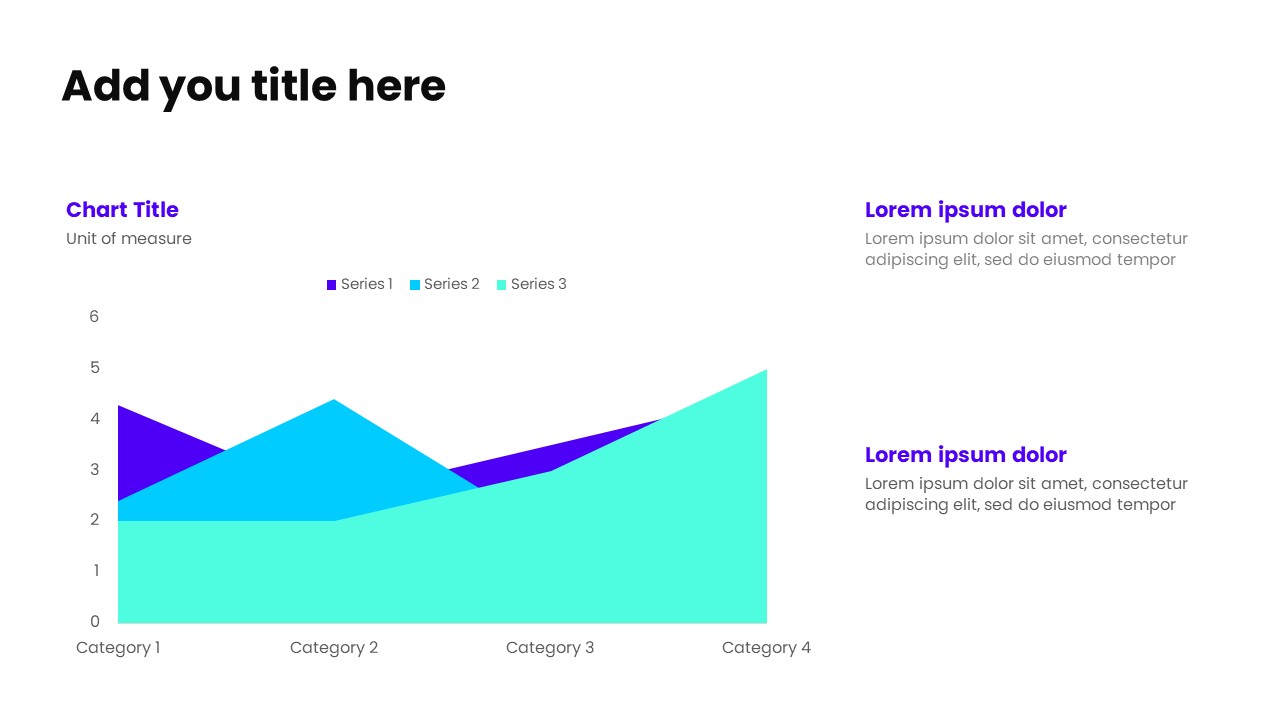
Visualize trends and changes over time using this PowerPoint area chart template, featuring the chart positioned on the left for strong visual focus. A supporting header with unit of measure helps viewers quickly interpret the data scale, while the right-hand panel includes multiple headers with concise sub-text to explain trends, patterns, and key observations.Ideal for growth analysis, performance tracking, time-based comparisons, and executive dashboards, this layout combines smooth trend visualization with contextual insights—making complex data easier to understand. Fully editable and suitable for business and data-driven presentations.
No reviews and ratings yet.
-
 Ready-made slides
-
Easy to customize
-
For personal & business