Slidesbuy
Enjoy Premium Plans at Signup ~50% OFF
Main Product
Live Preview Preview

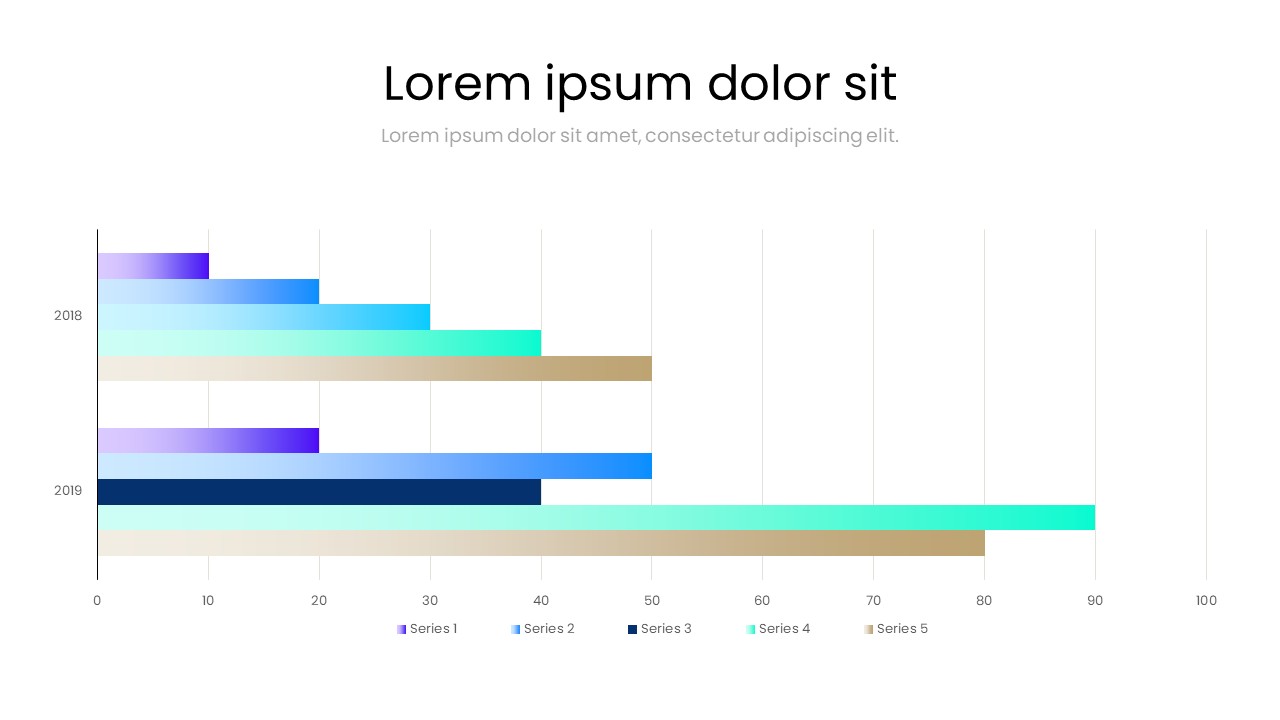
A professional PowerPoint slide featuring a horizontal bar chart comparing multiple data series between 2018 and 2019. Ideal for business reports, analytics dashboards, and corporate presentations showing performance trends and year-to-year growth.

No Reviews and Rating

Regular License

Use, by you or one client, in a solitary finished result which end clients are not charged for. The complete cost incorporates the thing cost and a purchaser expense..

Extended License

Use, by you or one client, in a solitary final result which end clients can be charged for. The all out cost incorporates the thing cost and a purchaser expense.

  • Accessible Paid
  • Published By Slidesbuy
  • Published On Mar 07, 2026
  • Last Update Mar 07, 2026
  • Code S1242
  • Categories Charts & Diagrams
  • Color Red,Green
  • Support version All Microsoft PowerPoint version,and Office 365,Mac PowerPoint: 2011 and later,Google Slides (compatible),Keynote (compatible)
  • Tags PowerPoint templates Business Marketing Pitch deck Sales presentation Charts & Diagrams Chart Bar chart