Enjoy Premium Plans at
Signup
~50% OFF

Clustered Chart PowerPoint Template
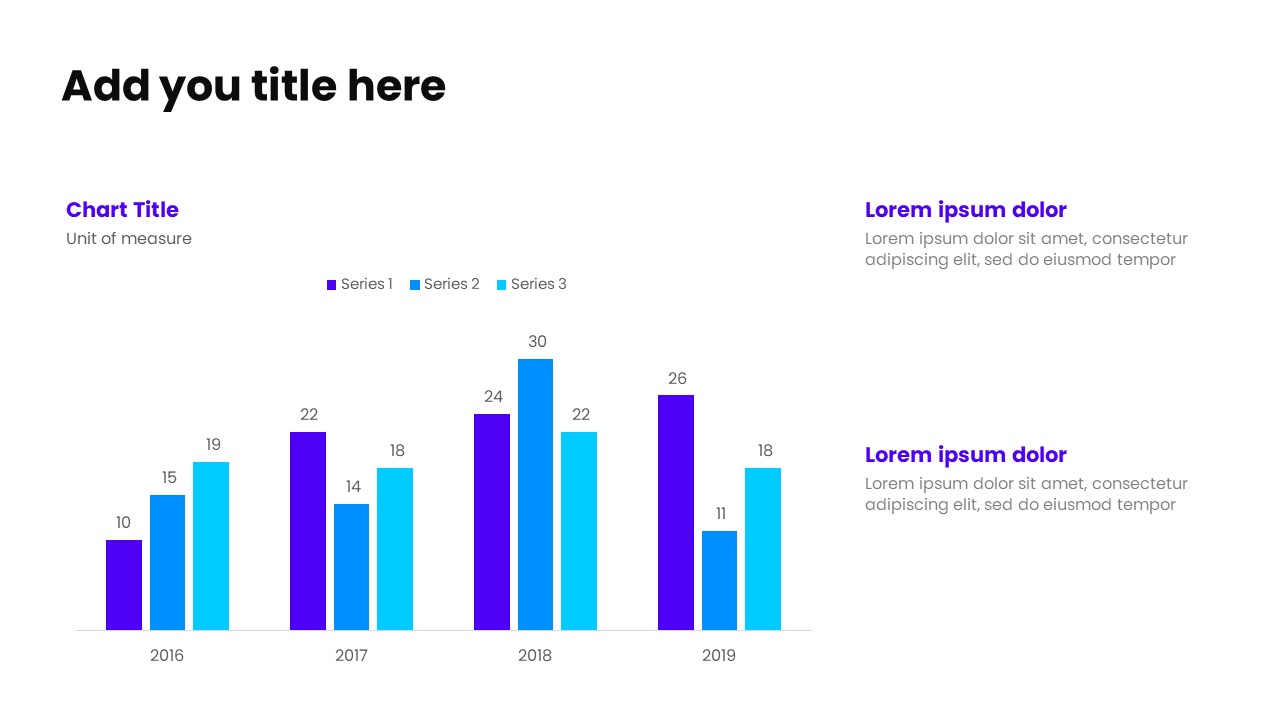
Present data clearly and professionally using this PowerPoint clustered column chart template designed with the chart positioned on the left for immediate visual impact. A supporting header with unit of measure helps viewers instantly understand the data scale, while the right-hand side features multiple headers with concise sub-text to explain trends, insights, or key takeaways.Ideal for performance analysis, business reports, KPI reviews, and executive dashboards, this layout balances data visualization with context—making your message both informative and easy to interpret. Fully editable and suitable for corporate and data-driven presentations.
No reviews and ratings yet.
-
 Ready-made slides
-
Easy to customize
-
For personal & business