
Line Chart PowerPoint Template
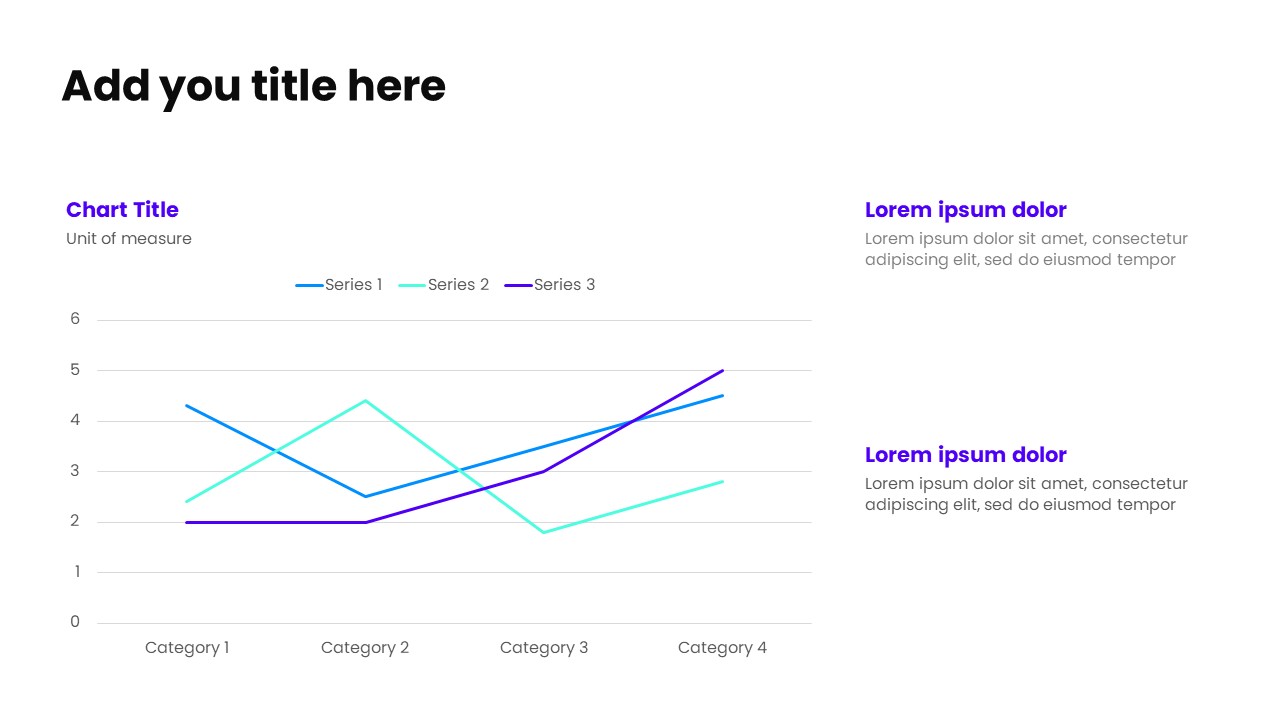
This slide features a line chart on the left, ideal for visualizing trends and changes over time with clarity and precision. The flowing lines make it easy to track performance, identify patterns, and compare multiple data series across periods. On the right, a structured text section with a clear header and supporting subtext provides space to interpret trends, highlight key milestones, and summarize insights.Perfect for time-series analysis, growth tracking, forecasting, and performance reporting, this layout blends visual storytelling with concise explanations. The balanced left–right design ensures trends are instantly recognizable while the supporting text adds context, making it an excellent choice for professional, data-driven presentations and dashboards.
No reviews and ratings yet.
-
 Ready-made slides
-
Easy to customize
-
For personal & business