Slidesbuy
Enjoy Premium Plans at Signup ~50% OFF
Main Product
Live Preview Preview

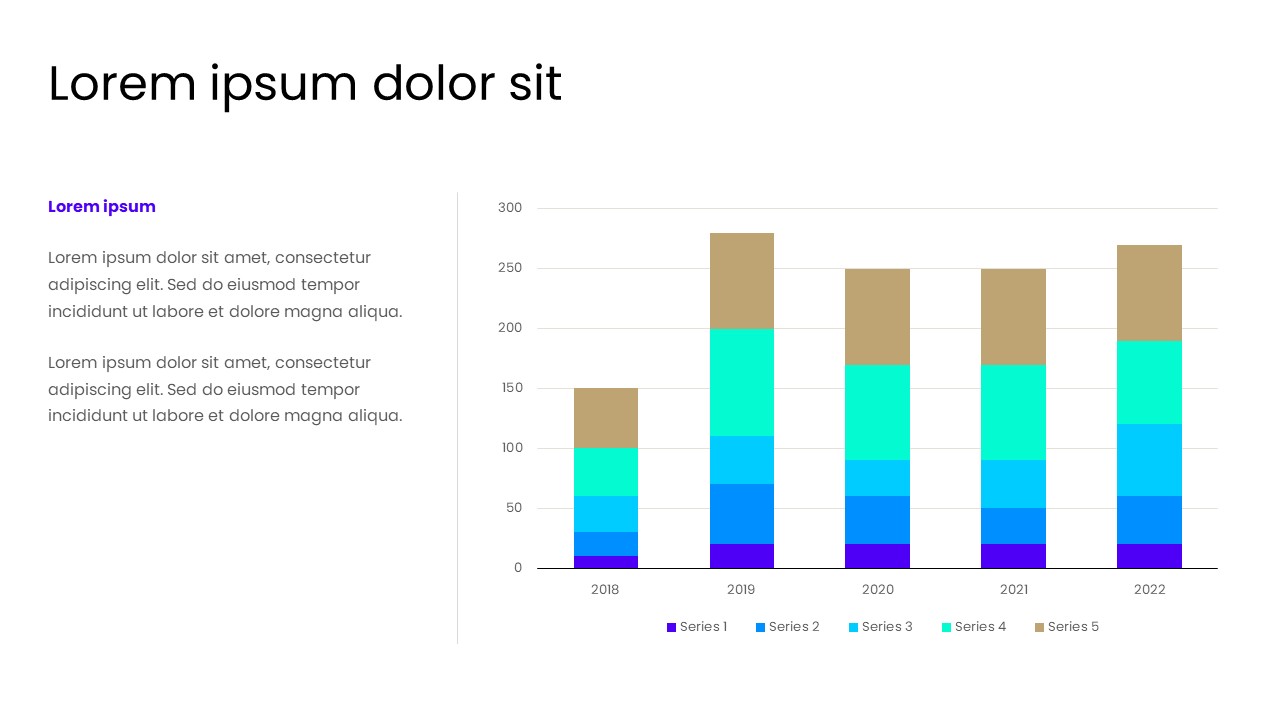
A modern stacked bar chart presentation slide designed for percentage-based business data comparison. This clean data visualization template shows multi-series performance distribution across multiple years, making it ideal for business analytics, marketing reports, and strategy presentations in PowerPoint, Google Slides, or Keynote.

No Reviews and Rating

Regular License

Use, by you or one client, in a solitary finished result which end clients are not charged for. The complete cost incorporates the thing cost and a purchaser expense..

Extended License

Use, by you or one client, in a solitary final result which end clients can be charged for. The all out cost incorporates the thing cost and a purchaser expense.

  • Accessible Paid
  • Published By Slidesbuy
  • Published On Mar 07, 2026
  • Last Update Mar 07, 2026
  • Code S1256
  • Categories Charts & Diagrams
  • Color Blue,Green
  • Support version All Microsoft PowerPoint version,and Office 365,Mac PowerPoint: 2011 and later,Google Slides (compatible),Keynote (compatible)
  • Tags PowerPoint templates Business Marketing Pitch deck Sales presentation Charts & Diagrams Chart Stacked Bar chart