
Stacked Bar Chart PowerPoint Template
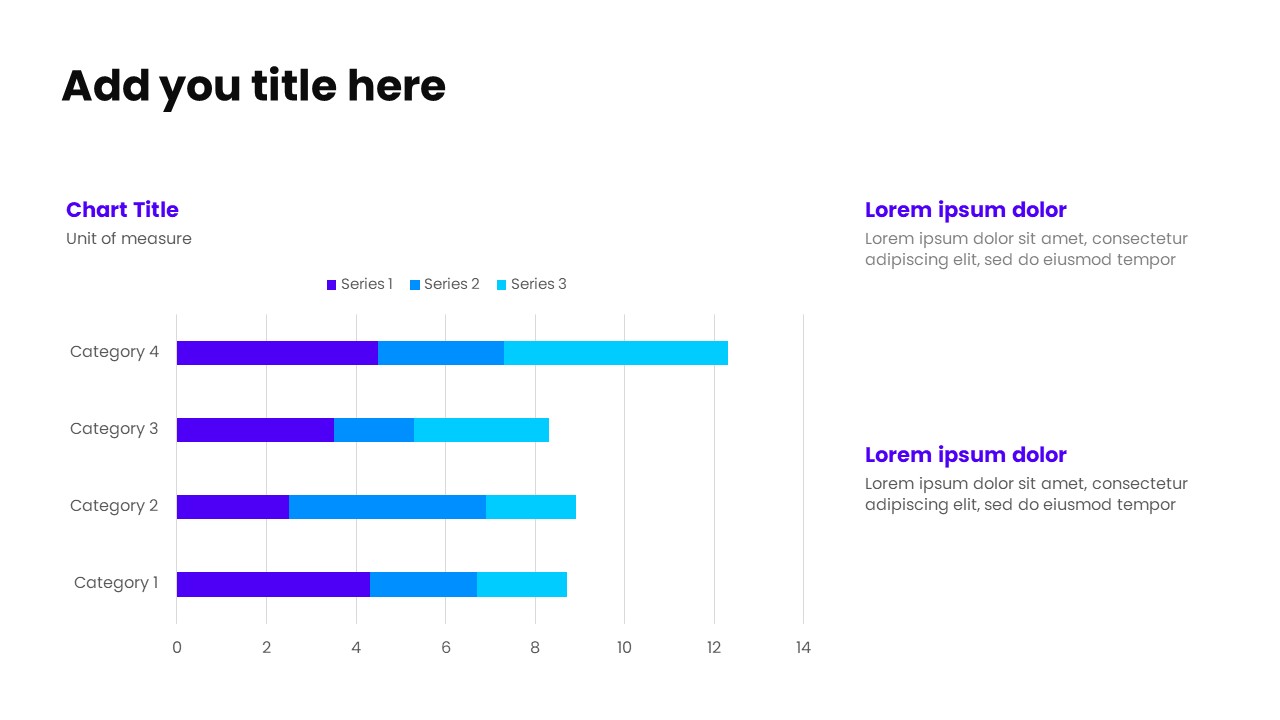
This slide presents a stacked bar chart on the left, designed to display both individual segment values and overall totals within each category. By stacking data segments into a single bar, the chart makes it easy to compare category performance while also understanding how each component contributes to the total. On the right, a clean content area with a clear header and supporting subtext helps explain insights, trends, and key observations.Ideal for composition analysis, category breakdowns, financial summaries, and performance comparisons, this layout combines analytical clarity with visual structure. The side-by-side design ensures the data remains easy to interpret while the supporting text reinforces key messages—perfect for professional reports and data-focused presentations.
No reviews and ratings yet.
-
 Ready-made slides
-
Easy to customize
-
For personal & business